[Discuss this article and read other’s comments on the subject on this thread on Hacker News.]
The three fundamental building blocks of computers, CPU, I/O and RAM can come under pressure due to contention and this is not uncommon. To both accurately size workloads and to increase hardware utilization, having information on how much pressure workloads are causing can come in very handy. This is also true for interactive workloads (think smartphones) where pressure information can be used to kill background processes to give the foreground process as many resources are possible so that the user can have a smooth experience.
Limitations of Linux Load Averages
But weren’t we always able to measure system pressure with load averages? That is true, but load averages have some shortcomings. Let’s first see how load averages look by running the uptime command:
➜  ~ uptime
 20:53:40 up  4:25,  1 user,  load average: 0.19, 0.25, 0.20
➜  ~
The three load averages are for the last 1, 5 and 15 minutes at the time of running the command. Under Linux, processes waiting for the CPU and those waiting for I/O, both add to the load average, which is good. Meaning, we know when either type of starvation happens. So, why was an improvement over this required? In other words, why is a capability like PSI required?
- Load averages have to be interpreted relative to CPU count. For example, a load average of 4.0 on a system that has 4 CPU cores means that there was no starvation at all. This is because the load averages reported are the number of processes that are waiting. You can’t get the actual time processes were being starved for.
- CPU and I/O are lumped into one number. You’re out of luck if you want to track them separately because you have workloads that are both sensitive to CPU and I/O starvation.
- The minimum resolution for real pressure update is one minute. For example, if you continuously monitor the output of
uptimewith thewatchcommand while you run a simple tight loop (see below for such a loop with Python) on another terminal window, the tight loop will take up a 100% CPU immediately and starve other processes on a single-core system. But the 1-minute load average will begin approaching 1.0 only one full minute later. If you’ve been watching the load average to take a quick decisions on your CPU sensitive workloads, you’d be out of luck.
➜  ~ python3
Python 3.6.8 (default, Jan 14 2019, 11:02:34)
[GCC 8.0.1 20180414 (experimental) [trunk revision 259383]] on linux
Type "help", "copyright", "credits" or "license" for more information.
>>> while True:
...     pass
...
Linux Pressure Stall Information (PSI)
Out to address the limitations of load average is PSI. Although it was added in Linux kernel version 4.2.0 4.20.0, with kernel 5.2, it comes with the additional feature of being able to notify programs that need to know if a certain level of pressure builds up within a specified time window. This puts it in a totally different league compared to load average, which is just static information.
For this article and the code herein, I installed kernel 5.2.6 from the Ubuntu mainline kernel PPA on my Ubuntu 18.04 machine. At the time of this writing, kernel 5.2 is fairly new and is yet to find its way into stable distributions. So, you may need to install a kernel newer than 5.2.0 and boot with it. I won’t go into the details of how to install newer kernels on your Linux distribution. This information should be easily obtainable. You also need to ensure that the kernel you end up running has PSI enabled. Thankfully, Ubuntu mainline kernel builds do.
Assuming henceforth you are running a kernel newer than 5.2.0, let’s move ahead and take a look at the interface PSI provides on to user space. You should be able to see a directory /proc/pressure and you should also be able to see 3 files inside of it:
➜  ~ ls -l /proc/pressure
total 0
-r--r--r-- 1 root root 0 Aug 28 07:06 cpu
-r--r--r-- 1 root root 0 Aug 28 07:06 io
-r--r--r-- 1 root root 0 Aug 28 22:22 memory
➜  ~
Let’s take a look at the contents of the /proc/pressure/cpu file:
➜  ~ cat /proc/pressure/cpu
some avg10=0.05 avg60=0.04 avg300=0.01 total=576927401
➜  ~
You see four total fields: avg10, avg60 and avg300 and total. The avg* fields represent the percentage of time in the last 10, 60 and 300 seconds respectively that processes were starved of CPU. For example, if there was 1 process taking 100% of the CPU on a single core system for the past 300 seconds, all these numbers would be zero. Meaning, there was no starvation since there was one process for the one available CPU, but no contention from any other process for CPU. Now, although these values can be interpreted independently of the number of available CPUs, these are not very different from our old friend, the load average. Albeit, while the minimum available resolution was 1 minute for the load average, here we have 10 seconds. Since pressure information about CPU will be available to administrators 6x faster compared to load average, PSI is already useful, but we’re just scratching the surface with PSI.
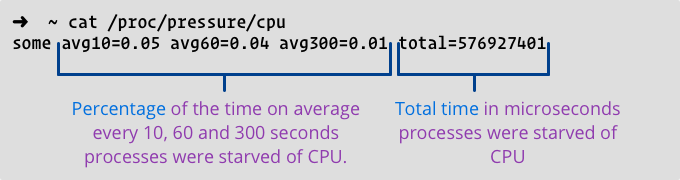
The total field is a lot more interesting. It represents the total time in microseconds that processes were starved for CPU. If you keep reading this file every 100 milliseconds and subtract the value of total read previously, you will get the time in microseconds for which processes were starved of CPU between your previous read and now. So, we’re talking something very high-resolution here. This is not comparable to anything previously available on Linux.
If you repeated the experiment we did with watch, uptime and the Python tight loop earlier with PSI, you can see that the total field is updated practically in real-time. While the avg10, avg60 and avg300 fields take time to update, there is no need to wait to see total being updated. This kind of high resolution provides system administrator with almost instant feedback to check if workloads are within an acceptable limit of pressure. If not, they can decide if they want to kill low-priority jobs or restart some workloads to other systems, for example. In fact, this is the kind of stuff PSI is used for today.
Now, let’s move on to the other two files, /proc/pressure/io and /proc/pressure/memory:
➜  ~ cat /proc/pressure/memory
some avg10=0.00 avg60=0.00 avg300=0.00 total=0
full avg10=0.00 avg60=0.00 avg300=0.00 total=0
➜  ~ cat /proc/pressure/io
some avg10=0.00 avg60=0.00 avg300=0.00 total=90691851
full avg10=0.00 avg60=0.00 avg300=0.00 total=75637729
➜  ~
Unlike the /proc/pressure/cpu file, these 2 files have two lines instead of one. The line prefixed with some represents the pressure for at least one process which could have been running, while the line prefixed with full represents the pressure for all processes. For memory, if you see large numbers in full, it means no runnable/non-idle process was able to run and the CPU was busy doing housekeeping work related to paging. Even small numbers here should worry system administrators since they clearly indicate workloads that are being starved of RAM. So, while the numbers in some indicate that while the system is strained of resources and some runnable processes are starved, it does mean that other processes continue to run and real work is getting done. However, when you see numbers in full, it means no real user processes are running. So, it’s all a clever way of packing a lot of meaning in just 2 lines of text.
It is also worth noting that PSI is able to differentiate between demand paging and thrashing, which is lovely. For pressure information, it only considers thrashing.
/proc/pressure/io is comparable to proc/pressure/memory conceptually.
PSI Notifications
If you have a monitoring process or agent that needs to be in the know about system pressure you can of course keep reading files inside of /proc/pressure to figure out what’s happening. But there is a better way. PSI can notify processes via poll() and here is how it works. You tell PSI the kind of pressure limit you are interested in by opening and writing to one of the files inside of /proc/pressure and add that file descriptor to the list monitored by poll().
For instance, you are interested to know if within any 1 second time window any process is starved for CPU at least for 100 milliseconds, you open /proc/pressure/cpu and write into it the following:
some 100000 1000000
Please note that the values specified are in microseconds so that a much high resolution notification is possible, should you need it. Given this information, let’s write some code and check out PSI notifications and how they work.
Linux PSI by Example
We’ve seen how to setup PSI notifications theoretically with poll(). The idea is to take that and apply it by writing 2 C language programs: monitor.c and create_load.c. With create_load.c, we generate two types of load: CPU load and I/O load. In monitor.c, we ask PSI to notify us when, in a 1 second window, if any process is being starved of either CPU or I/O capacity for 100 milliseconds or more. You first need to run ./monitor and while that is running, from another terminal window, you need to run ./create_load, which creates CPU and I/O load.
In create_load.c, we create CPU load by creating one thread more than there are CPUs and running tight loops in them all. If you create one thread for every CPU core on your system, you’ll get your server to be busy 100% of the time, but you won’t be starving any process of CPU, unless there are other CPU-intensive processes running alongside. By default, we run these threads for 10 seconds, good enough for us to starve at least one thread of CPU some of the time. This should create PSI notifications for us, which are then displayed by the monitor program.
To create I/O load, create_load.c employs a best-effort method:
- It reads all the top level directories in the root folder
- It then splits the list of directories in two halves down the middle
- Starts two threads, giving them each one half of the list of directories
- Each of these I/O Loader threads recursively traverses these directories for files, doing a
stat(), anopen()and aread()of 16kB.
We do this in parallel using 2 threads so that we generate as much load as possible. It is entirely possible that your system has a fantastic SSD for which this load is a cakewalk, but I doubt it. It should cause enough I/O starvation for one of the threads that monitor gets notified. If you don’t see I/O starvation notifications, a) congratulate yourself because you are the owner of a nice system, and b) modify create_load.c to start more than the current 2 parallel threads that cause plenty of I/O.
Once create_load runs the kernel will cache directory entry and file contents in RAM. How much it caches depends on the amount of disposable RAM you have. Running create_load subsequently may not cause I/O starvation since most of the data should directly come from the disk cache. To run create_load subsequently, you may need to drop the kernel’s disk caches and so the program displays a command to let you do just that.
Here’s create_load.c:
#include <stdio.h>
#include <unistd.h>
#include <pthread.h>
#include <dirent.h>
#include <stdlib.h>
#include <string.h>
#include <sys/stat.h>
#include <fcntl.h>

/*
 * These defines are the number of seconds for which we load
 * CPU or I/O
 * */
#define CPU_LOAD_TIME_SECS  10
#define IO_LOAD_TIME_SECS   10

/*
 * We split a list of directories to traverse between 2 I/O
 * Loader threads. This struct is passed to each of them,
 * letting them know the starting index of that list and
 * number of directories to traverse.
 *
 * */

typedef struct dir_list {
    char **dirs;
    int begin_idx;
    int count;
}dir_list;

/*
 One function that prints the system call and the error details
 and then exits with error code 1. Non-zero meaning things didn't go well.
 */
void fatal_error(const char *syscall)
{
    perror(syscall);
    exit(1);
}

/*
 * Get all the top level directories from the root directory.
 * */
char **get_root_dir_entries() {
    char **entries = NULL;
    DIR *root_dir = opendir("/");
    if (root_dir == NULL)
        fatal_error("readdir()");

    struct dirent *dir;
    int i = 0;
    while ((dir = readdir(root_dir)) != NULL) {
        /* We only save directories and those with names other than "." or ".." */
        if (dir->d_type != DT_DIR || strcmp(dir->d_name, ".") == 0 || strcmp(dir->d_name, "..") == 0)
            continue;

        entries = realloc(entries, sizeof(char *) * (i + 1));
        entries[i] = malloc(strlen(dir->d_name) + 2);
        strcpy(entries[i], "/");
        strcat(entries[i], dir->d_name);
        i++;
    }
    closedir(root_dir);

    /* We NULL-terminate the list */
    entries = realloc(entries, sizeof(char *) * (i + 1));
    entries[i] = NULL;

    return entries;
}

/*
 * This function is the one that causes the actual I/O load.
 * It recursively traverses the directory passed as an argument.
 * */

void read_dir_contents(char *dir_path) {
    struct dirent *entry;
    struct stat st;
    char buff[16384];
    DIR *dir = opendir(dir_path);
    if (dir == NULL)
        return;

    while ((entry = readdir(dir)) != NULL) {
        /* Let's get the attributes of this entry.
         * Though we don't need it, this generates more I/O. */
        stat(entry->d_name, &st);

        if (entry->d_type == DT_REG) {
            /* Regular file. Read a little bit from it. */
            int fd = open(entry->d_name, O_RDONLY);
            if (fd > 0) {
                read(fd, buff, sizeof(buff));
                close(fd);
            }
        }
        if (entry->d_type == DT_DIR && strcmp(entry->d_name, ".") != 0 && strcmp(entry->d_name, "..") != 0) {
            /* Found a directory, let's get into it recursively */
            char new_path[1024];
            snprintf(new_path, sizeof(new_path), "%s/%s", dir_path, entry->d_name );
            read_dir_contents(new_path);
        }
    }
    closedir(dir);
}

/*
 * This function is called in a thread. It it iterates through the list
 * of directories passed and calls read_dir_contents() for each directory
 * in the list.
 *
 * Since 2 threads are created and they get passed the same list of
 * directories, we pass the starting index and the count of directories
 * to traverse so that each thread can, in parallel, act on its own
 * unique set of directories. This creates more I/O load since 2 threads
 * access the filesystem information / data in parallel.
 *
 * */

void *iterate_dirs(void *data) {
    time_t time1 = time(NULL);
    time_t time2;
    dir_list *dl = (dir_list *) data;
    printf("I/O Loader thread starting with %d directories to traverse.\n", dl->count);
    char **dirs = dl->dirs;
    char *dname;
    int i = dl->begin_idx;
    while (dl->count--) {
        dname = dl->dirs[i++];
        read_dir_contents(dname);
        time2 = time(NULL);
        if (time2 - time1 >= IO_LOAD_TIME_SECS)
            break;
    }

    return NULL;
}

/*
 * This function gets the names of top-level directories in the root
 * directory, splits up that list and passes it to two threads both
 * running the same function, iterate_dirs().
 * */

void load_disk() {
    int i = 0;
    pthread_t pthread1, pthread2;

    char **root_dir_entries = get_root_dir_entries();
    while (root_dir_entries[i++] != NULL);

    dir_list dl1, dl2;
    dl1.dirs = root_dir_entries;
    dl1.begin_idx = 0;
    dl1.count = i/2;

    dl2.dirs = root_dir_entries;
    dl2.begin_idx = dl1.count - 1;
    dl2.count = i - dl1.count;

    pthread_create(&pthread1, NULL, iterate_dirs, (void *) &dl1);
    pthread_create(&pthread2, NULL, iterate_dirs, (void *) &dl2);

    /* Wait for both the threads to run to completion */
    pthread_join(pthread1, NULL);
    pthread_join(pthread2, NULL);

    printf("********************************************************************************\n");
    printf("Now that the I/O loader threads have run, disk blocks will be cached in RAM.\n");
    printf("You are unlikely to see further I/O-related PSI notifications should you run\n");
    printf("this again. If you want to however, you can run this again after dropping all\n");
    printf("disk caches like so as root:\n");
    printf("\necho 3 > /proc/sys/vm/drop_caches\n");
    printf("\nOr with sudo:\n");
    printf("echo 3 | sudo tee /proc/sys/vm/drop_caches\n");
    printf("********************************************************************************\n");

    /* Free allocated memory */
    i = 0;
    while (root_dir_entries[i++] != NULL)
        free(root_dir_entries[i]);
    free(root_dir_entries);
}

/*
 * This routine runs in threads. This creates load on the CPU
 * by running a tight loop for CPU_LOAD_TIME_SECS seconds.
 *
 * We create a thread more than there are CPUs. e.g: If there
 * are 2 CPUs, we create 3 threads. This is to ensure that
 * the system is loaded *beyond* capacity. This creates
 * pressure, which is then notified by the PSI subsystem
 * to our monitor.c program.
 *
 * */
void *cpu_loader_thread(void *data) {
    long tid = (long) data;
    time_t time1 = time(NULL);
    printf("CPU Loader thread %ld starting...\n", tid);

    while (1) {
        for (tid=0; tid < 50000000; tid++);
        time_t time2 = time(NULL);
        if (time2 - time1 >= CPU_LOAD_TIME_SECS)
            break;
    }
    return NULL;
}

void load_cpu() {
    /* Some crazy future-proofing when this runs
     * on a 1024-core Arm CPU. Sorry, Intel.*/
    pthread_t threads[1024];

    /* Get the number of installed CPUs and create as many +1 threads. */
    long num_cpus = sysconf(_SC_NPROCESSORS_ONLN);
    for (long i=0; i < num_cpus + 1; i++) {
        pthread_create(&threads[i], NULL, cpu_loader_thread, (void *) i);
    }

    /* Wait for all threads to complete  */
    for (long i=0; i < num_cpus; i++) {
        pthread_join(threads[i], NULL);
    }
}

int main() {
    load_cpu();
    load_disk();
    return 0;
}
While create_load lets you create CPU and I/O load, I stopped short of creating memory load. For this, the program would have to push memory usage over to the edge and this makes working on such a system a very unpleasant experience. Moreover, seeing these 2 starvations in action should give you a very clear idea about what PSI is all about. There is nothing dramatically different to learn from the memory starvation use case to warrant pushing your system over the edge.
Monitoring for notifications is like we discussed earlier. We write to files inside of /proc/pressure and we get notified with events via the poll() system call.
Here’s monitor.c:
#include <stdio.h>
#include <poll.h>
#include <fcntl.h>
#include <sys/stat.h>
#include <stdlib.h>
#include <unistd.h>
#include <string.h>

#define CPU_TRACKING_WINDOW_SECS    1
#define IO_TRACKING_WINDOW_SECS     1
#define CPU_TRIGGER_THRESHOLD_MS    100
#define IO_TRIGGER_THRESHOLD_MS     100
#define CPU_PRESSURE_FILE           "/proc/pressure/cpu"
#define IO_PRESSURE_FILE            "/proc/pressure/io"
#define FD_CPU_IDX                  0
#define FD_IO_IDX                   1

struct pollfd fds[2];

/*
 One function that prints the system call and the error details
 and then exits with error code 1. Non-zero meaning things didn't go well.
 */
void fatal_error(const char *syscall)
{
    perror(syscall);
    exit(1);
}

/*
 * PSI allows programs to wait for events related to pressure stalls
 * via poll() so that they can avoid continuously polling files in the
 * /proc/pressure directory.
 *
 * We setup to be notified via poll for two types of PSI events, one
 * for CPU and the other for I/O.
 *
 * */

void setup_polling() {
    /* Let's first setup our CPU PSI trigger */
    fds[FD_CPU_IDX].fd = open(CPU_PRESSURE_FILE, O_RDWR | O_NONBLOCK);
    if (fds[FD_CPU_IDX].fd < 0)
        fatal_error("open(): " CPU_PRESSURE_FILE);

    /* Next, our I/O PSI trigger */
    fds[FD_IO_IDX].fd = open(IO_PRESSURE_FILE, O_RDWR | O_NONBLOCK);
    if (fds[FD_IO_IDX].fd < 0)
        fatal_error("open(): " IO_PRESSURE_FILE);

    fds[FD_CPU_IDX].events = fds[FD_IO_IDX].events = POLLPRI;

    char trigger[128];
    snprintf(trigger, 128, "some %d %d", CPU_TRIGGER_THRESHOLD_MS * 1000, CPU_TRACKING_WINDOW_SECS * 1000000);
    printf("Trigger: %s\n", trigger);
    if (write(fds[FD_CPU_IDX].fd, trigger, strlen(trigger) + 1) < 0)
        fatal_error("write(): " CPU_PRESSURE_FILE);
    snprintf(trigger, 128, "some %d %d", IO_TRIGGER_THRESHOLD_MS * 1000, IO_TRACKING_WINDOW_SECS * 1000000);
    printf("Trigger: %s\n", trigger);
    if (write(fds[FD_IO_IDX].fd, trigger, strlen(trigger) + 1) < 0)
        fatal_error("write(): " IO_PRESSURE_FILE);
}


/*
 * This is the main function where we wait for notifications from
 * PSI. We increment 2 separate variables that track CPU and I/O
 * notification counts separately and print them.
 * */

void wait_for_notification() {
    int cpu_event_counter = 1;
    int io_event_counter = 1;

    while (1) {
        int n = poll(fds, 2, -1);
        if (n < 0) {
            fatal_error("poll()");
        }

        for (int i = 0; i < 2; i++) {

            /* If the fd of the current iteration does not have any
             * events, move on to the next fd.
             * */
            if (fds[i].revents == 0)
                continue;

            if (fds[i].revents & POLLERR) {
                fprintf(stderr, "Error: poll() event source is gone.\n");
                exit(1);
            }
            if (fds[i].revents & POLLPRI) {
                if (i == FD_CPU_IDX)
                    printf("CPU PSI event %d triggered.\n", cpu_event_counter++);
                else
                    printf("I/O PSI event %d triggered.\n", io_event_counter++);
            } else {
                fprintf(stderr, "Unrecognized event: 0x%x.\n", fds[i].revents);
                exit(1);
            }
        }
    }
}

/*
 * We check for tell-tale signs of the running kernel supporting PSI.
 * Else, we print a friendly message and exit.
 * */

void check_basics() {
    struct stat st;
    int sret = stat(CPU_PRESSURE_FILE, &st);
    if (sret == -1) {
        fprintf(stderr, "Error! Your kernel does not expose pressure stall information.\n");
        fprintf(stderr, "You may want to check if you have Linux Kernel v5.2+ with PSI enabled.\n");
        exit(1);
    }
}

int main() {
    check_basics();
    setup_polling();
    wait_for_notification();
    return 0;
}
Source Code
Clone the psi-by-example Github repo and run make all. You should have both executables in your current directory.
About me
My name is Shuveb Hussain and I’m the author of this Linux-focused blog. You can follow me on Twitter where I post tech-related content mostly focusing on Linux, performance, scalability and cloud technologies.
You must be logged in to post a comment.